
What makes a good newsroom?
With help from Prezly colleagues, customers and twitter I now have a list of about 60 newsroom URLs from well-known brands, but which ones are the best?
In this post, I will explore different ways to score those newsrooms on their technical foundations. Obviously, a good newsroom is about a lot more than performance and accessibility but let's start with the basics.
Here are the criteria I will use to order the list:
- Lighthouse Score
- Page Speed
- Accessibility
- Search Engine Friendliness
- Ahrefs.com data
- Url Rating
- Domain Rank
- Referring domains
- Search Traffic Estimate
Assigning weights to those different criteria and averaging it in a single number will result a pretty accurate score around the technical foundations.
Lighthouse Score
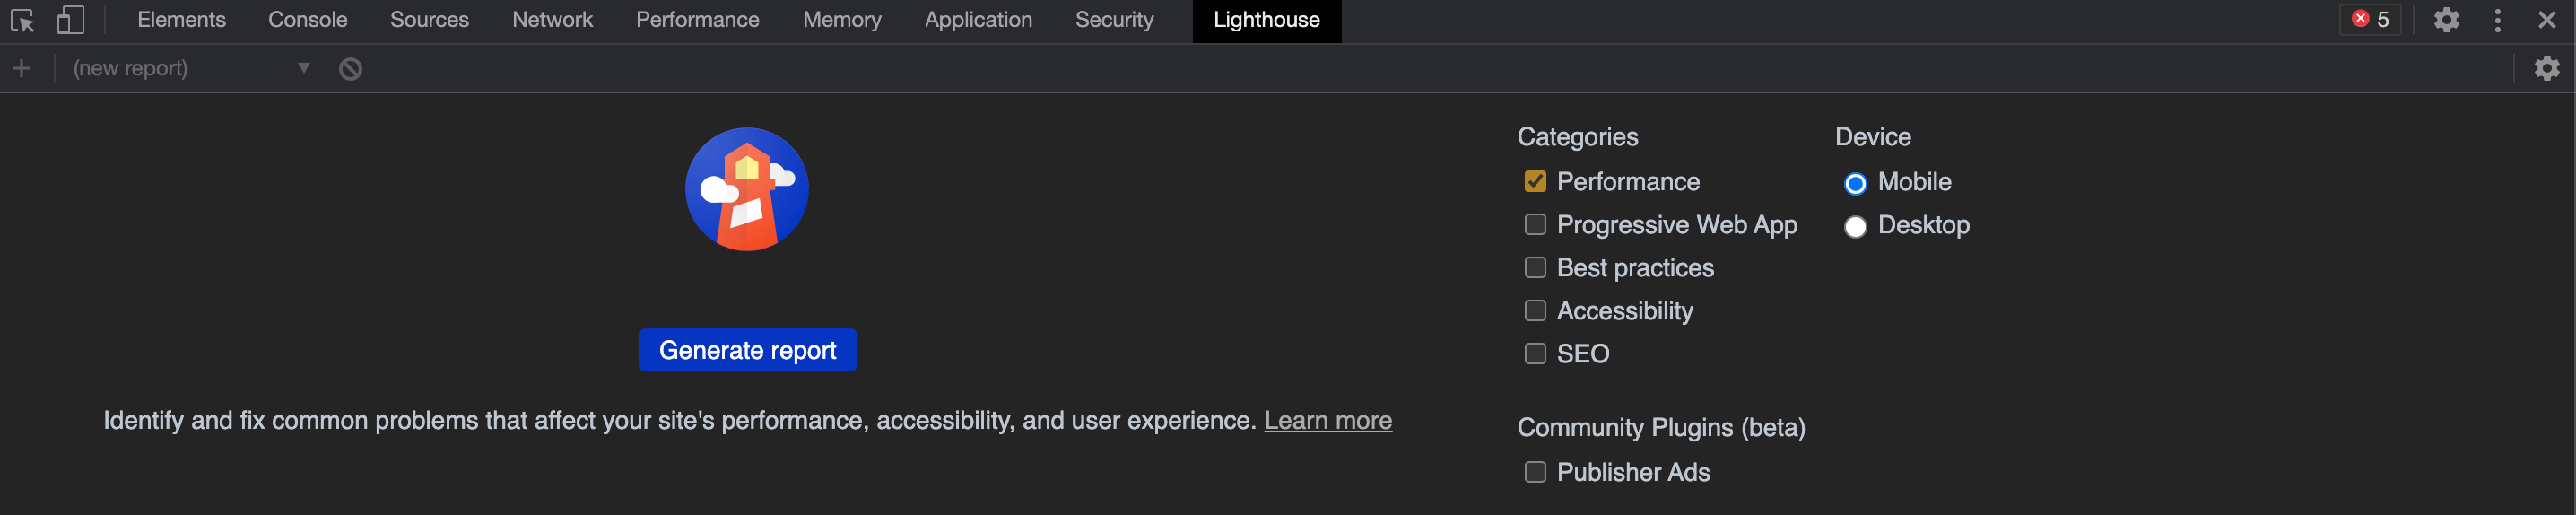
There is a great way to measure some web fundamentals (performance, accessibility, best practices and SEO) and it's called Lighthouse. It actually comes with every chrome install by opening dev tools and clicking the Lighthouse tab that allows you to generate a report of any site you visit:
Page Speed
A critical component in what makes a good newsroom is speed. Speed is the killer feature. Running a lighthouse score on the Nike newsroom for example would, at the time of writing (March 8, 2021) give you a score of 62% doing a performance audit with a mobile device:

Running the lighthouse audit for almost 100 newsrooms would take me too much time but there is a way to run the same audit through code (using node).
Here is the code I used to walk through all the newsrooms and run both a desktop and mobile audit and feed the scores back to the airtable sheet:
Running the audit took about 30 minutes and did crash Chrome a few times while it was running. The average desktop performance score is 41% with the median being 39%. Not a single newsroom is scoring over 80% in desktop performance.
The fastest newsrooms on the list: Revolut, Airbnb, Walt Disney and Netflix. Not surprisingly all companies that understand the importance of speed
Accessibility
A second way of scoring the sites is accessibility. Here is how w3c describes accessibility:
When websites and web tools are properly designed and coded, people with disabilities can use them. However, currently many sites and tools are developed with accessibility barriers that make them difficult or impossible for some people to use. Making the web accessible benefits individuals, businesses, and society. International web standards define what is needed for accessibility.
Lighthouse can score accessibility with the same audit tool returning a score that is a weighted average of a different set of accessibility audits. I used pretty much the same code to run both an accessibility and a SEO audit for all different newsrooms:
This audit took a lot less time to run. The audit was surprising as the top-3 was different from the performance audit with Nestle, Visa and Starbucks leading by example with +98% scores.
Search Engine Optimalisation (SEO)
The time spent on small improvements that benefit the on-page SEO paints some kind of picture to what level of detail was spent on a site. Here is an example lighthouse audit of a site like the Starbucks story:
")
The code to run that audit is posted above and all the results are available in the airtable sheet. Facebook, Instagram (same engine?), and Airbnb all score 100% on SEO.
In the paragraphs below we'll be using ahrefs.com to go deeper into the SEO ranking.
Averaging those tech scores here is the top-15 newsrooms so far:

Ahrefs.com
Ahrefs offers a set of tools allowing you to audit any site on the internet. From their website
Ahrefs is an All-in-one SEO toolset, with free Learning materials and a passionate Community & support
In our case we want to get a few indicators about the collected newsrooms. I could look at 50+ different data points but for the sake of simplicity I will keep it to these:
- URL Rating (UR) shows the strength of a page's link profile on a 100-point scale. The bigger the number, the stronger a page's link profile is.
- Domain Rating (DR) shows the strength of a website's backlink profile compared to the others in hrefs database on a 100-point scale.
- Referring domains are websites from which the target website or web page has one or more backlinks. For example, if a web page has a backlink from the New York Times, then it has one referring domain. If it has a link from the New York Times and Forbes, that it has two referring domains. If it has two backlinks from the New York Times, then it still has one referring domain.
- Search Traffic Estimate is an ahrefs.com estimation of how much organic search traffic your target website, subfolder or URL gets each month.
As I don't want to fill in those numbers in the Airtable I upgraded to an Ahrefs.com API subscription and pulled in the data. Here is the code:
I know I can make this script much faster by parallelizing the request (feel free to suggest!) but my brain doesn't function well in an asynchronous world 🤯
URL and Domain Rating
Clear winners in URL and Domain rating are Apple, Facebook and Youtube. In this case, I believe online/technology brands have a clear advantage over their 'offline' counterparts.

While the bottom of the list has more what i call 'offline' brands such as Pepsi, Ford, Budweiser or Nestle. Small surprise in that bottom 20: Google and Microsoft 😬

Referring Domains
I have normalised the absolute domains (count of absolute domains linking to this page) to a percentage value. Apple has an astonishing 26 000 domains linking to their newsroom and facebook 14 000).
Because Google and Microsoft are at the bottom of the list I am suspecting something is wrong with the crawled ahref data.

Search Traffic Estimate
The search traffic estimate is an interesting number but not reliable for the final rankings. Ahrefs tries to guess the number of visitors/month the newsroom would receive by using SERP rankings and other SEO signals.
The median of all newsrooms is 540 visitors/month. Most newsrooms are in the same ballpark but outperforming everyone else in the list are Facebook with 14 million visitors/month and Youtube approaching 3 million visitors/month.
I will not use the search traffic estimate in the final summary as I noticed it wasn't trustworthy. 14 million?!
Summarizing
To summarise all this I decided to add weight to the different criteria.
- Lighthouse Score (60%)
- Page Speed (70%)
- Accessibility (20%)
- Search Engine Friendliness (10%) -> also in ahrefs.com
- Ahrefs.com data (40%)
- URL Rating (60%)
- Domain Rank (10%)
- Referring domains (30%)
Overall Lighthouse is taking 60% of the final score while ahref.com data gets 40%.

The results
It took a while to apply the weights in the Airtable formulas but I got there in the end.
At the moment of writing here is a list of the best 10 newsrooms based on the criteria and code outlined in this post:

Want to suggest another newsroom to include? Please suggest it